Initially, this website was created to present my professional career and ideas around software development. Recently, with my work on paragliding tracklogs and the Thermal Map, it has also become a personal space.
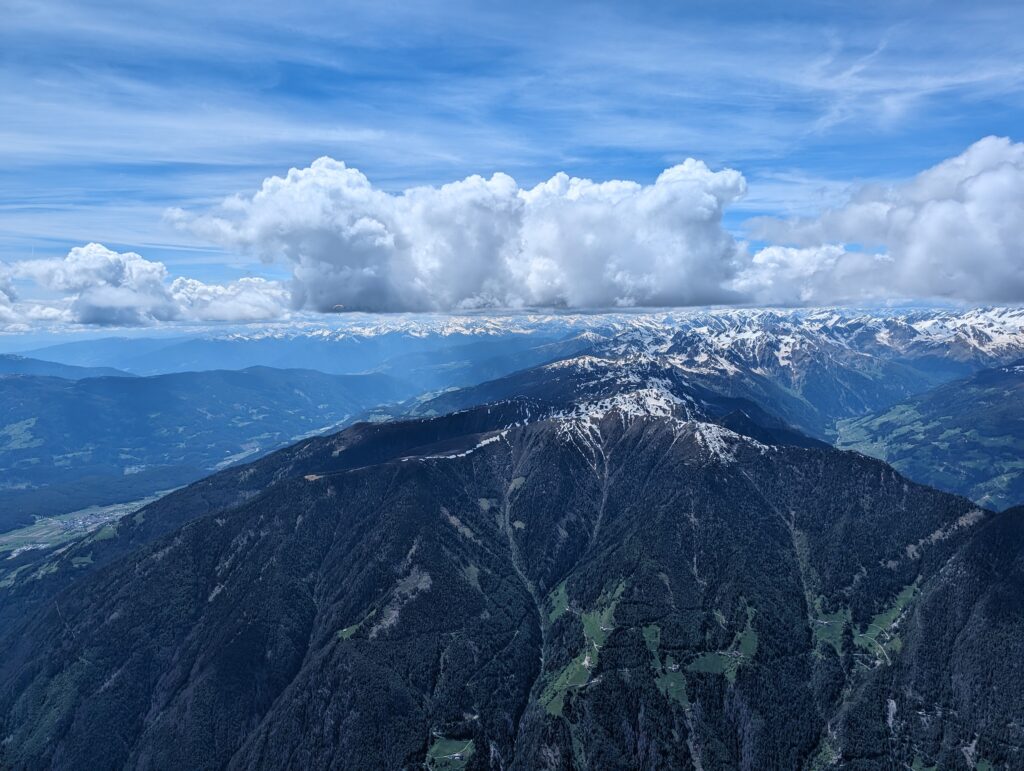
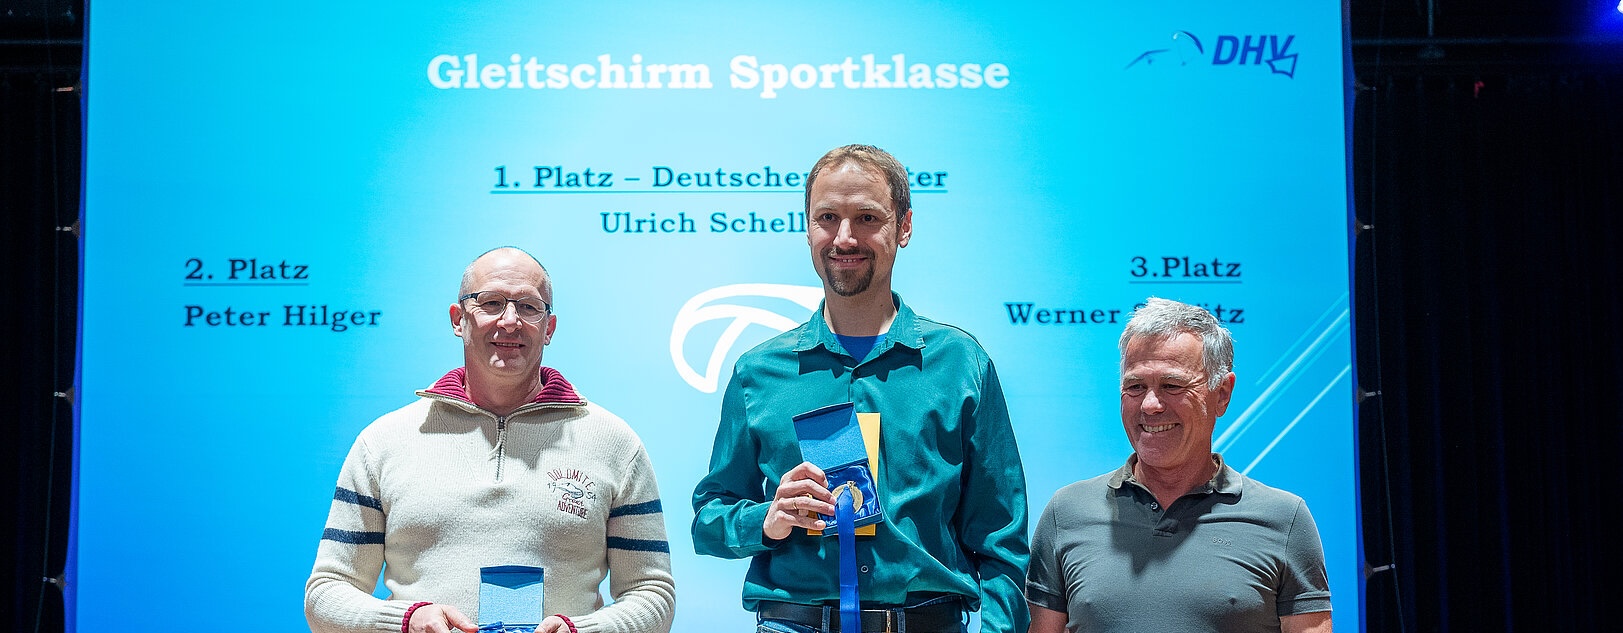
This paragliding season in the Alps was challenging due to the weather conditions. The best flight distances were significantly shorter than in previous seasons. Nonetheless, I managed to seize the right days to fly and achieved a new personal best with a 242 km FAI triangle in 10 hours and 27 minutes. This, along with two other long flights, secured me the first position in the DHV XC Sportsclass this year. This result was unexpected, and I am very pleased with it.

The Sportsclass is one out of three categorizations for paragliders. It contains gliders with a balance between safety and performance, while there is also a category for performance wings and another one for standard (maximum safety) wings. My paragliding club bodenlos was also able to win the Vereinswertung and Bundesliga for this year. Despite the challenging weather, we never had such a successful year before.
Contributing Factors
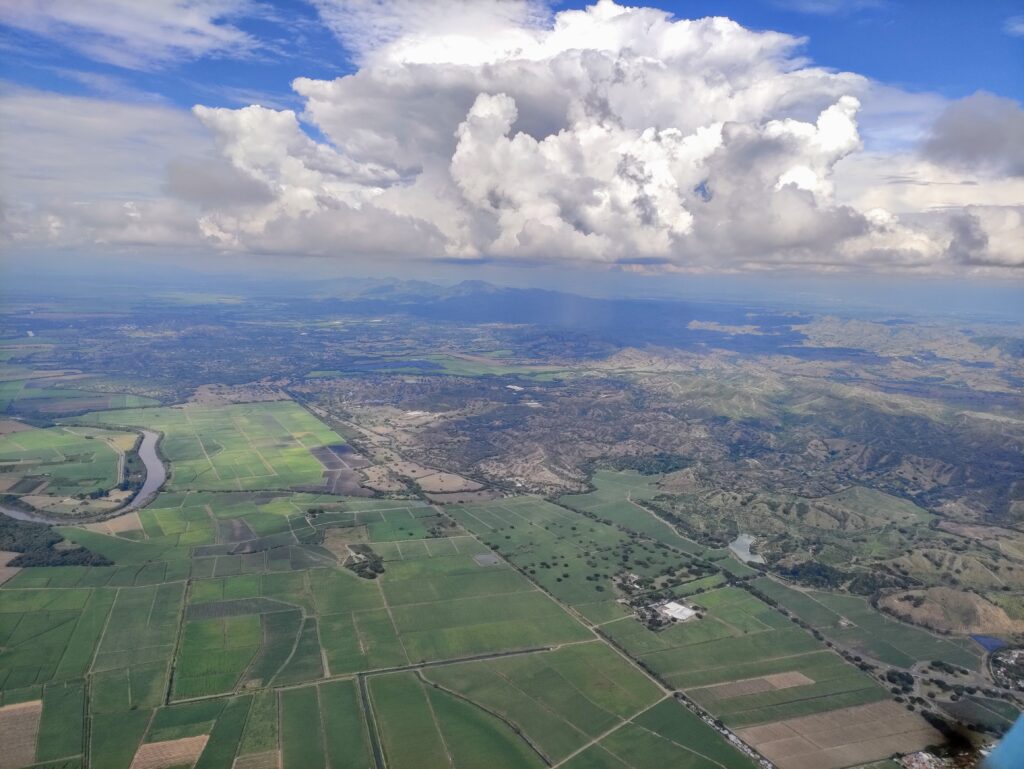
What contributed to these great results? Starting the season early in Colombia was a key factor. In 2024, Roldanillo attracted a significant number of bodenlos pilots. As a result, we logged around 80 hours of flight time while others were still experiencing winter blues.

One important aspect, especially for this website, is whether the Thermal Map played a significant role in these flights. I use the map on my XCTrack screen, and it serves as a helpful guide in certain situations. For most long flights, there are other pilots visible, and the routes are generally known. However, the Thermal Map allows me to approach the exact center of thermal activity with more confidence. Whenever there is no clear indicator of the next lift or I am unsure, this additional information is very handy.
The most crucial factor was learning the patterns of airflow. Every pilot needs a mental model of how air flows, where it rises and sinks, and where there are turbulences. Having historical data on a map helped me understand these patterns better and sometimes encouraged me to fly a bit further.
Conclusion
Why am I writing about this on my professional blog? Firstly, because I am proud of the achievement and enjoy sharing it. Additionally, this website attracts visits from other paragliding pilots who might be interested in the details or want to try using the Thermal Map themselves. For recruiters: mentioning that you have read this far will make your email stand out and receive special attention in my inbox.
Links
News Post on DHV (link does not contain a year, so it might disappear)
DHV XC Deutsche Gleitschirmwertung 2024 (Sportklasse)
My YouTube channel with some paragliding videos

